Pumped Storage
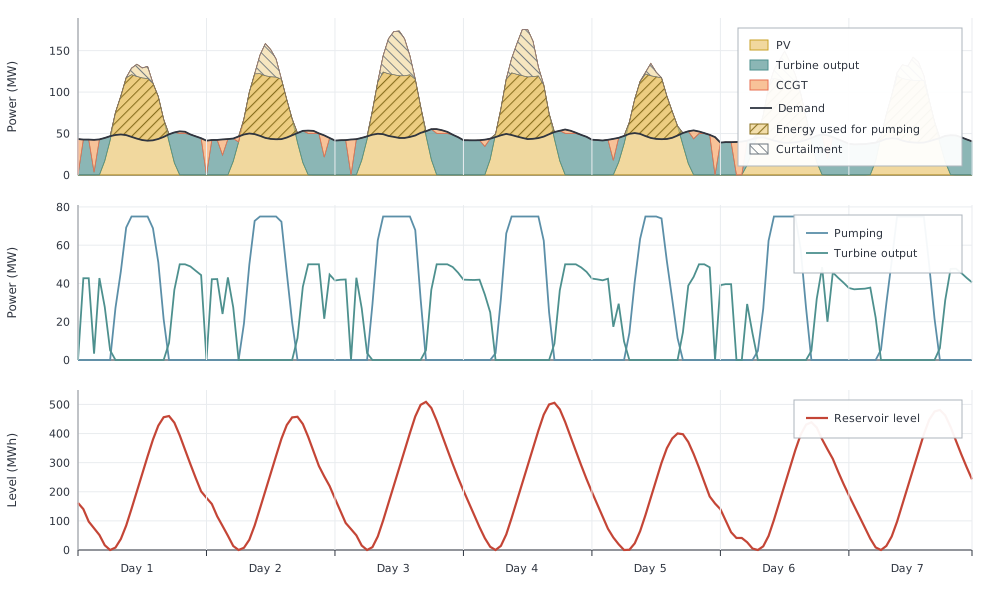
This example shows how pumped storage moves surplus PV to later hours. Daytime solar exceeds demand on the scaled workbook profile. A plant built with makehydroreservoir pumps that surplus into the reservoir and generates later on the same electricity node. There is no natural intake. A CCGT covers hours storage cannot reach. Capacities are fixed. The default TimeMesh() is circular, so the reservoir level wraps from the last hour into the first. Year-end and year-start are continuous.
using Posy2
using Nosy
using HiGHS
import JuMP: set_silent

# Simulation and Posy2 input configuration
sim = Sim(Model(HiGHS.Optimizer); mesh=TimeMesh())
set_silent(model(sim))
example_data_dir = joinpath(pkgdir(Posy2), "data")
snapshot = Snapshot(sim, Dict(:posy => Posy2Options(
    data_dir=example_data_dir,
    techdata_file="tech_data.xlsx",
    timeseries_file="time_series.xlsx",
    tech_mode=:arguments,
    timeseries_mode=:excel,
)))

# Electricity node and CO2 sink
electricity = Node("country1", EnergyCarrier("electricity country1", sim), rule=:curtailed, tags=[:electricity])
co2 = Node("CO2", CO2Carrier("CO2", sim), rule=:curtailed, tags=[:co2])

# Workbook country1 demand scaled to about 50 MW on average
makedemand("Demand", "country1", electricity, snapshot; profile_multiplier=0.068)

# Fixed 200 MW PV
makeintermittentsource(
    "Solar", electricity, snapshot; co2_node=co2, tech_column="PV",
    cap=200.0,
    weather_year=2019,
)

# Fixed 50 MW CCGT backup for hours storage cannot cover
makedispatchable(
    "CCGT", electricity, snapshot; co2_node=co2, tech_column="CCGT",
    cap=50.0,
    overnight_cost=955.0,
    decommissioning=0.05,
    lifetime=30,
    construction_profile=fill(1 / 3, 3),
    decommissioning_profile=[0.5, 0.5],
    om_var_cost=6.99,
    fuel_cost=47.06,
    co2_emission=348.0,
)

# Fixed pumped storage: 50 MW turbine, 75 MW pumping, 80% round-trip, no natural intake
makehydroreservoir(
    "Pumped hydro",
    "country1",
    electricity,
    snapshot; tech_column="Hydro res",
    discharge_cap=50.0,     # turbine capacity
    charge_cap=75.0,        # pumping capacity
    intake=0.0,             # no natural intake
    energy_cap=12_000.0,    # fixed reservoir energy capacity
    roundtrip_eff=0.8,
)

# Minimise total system cost and extract solved values
optimize!(snapshot, cost(snapshot))
result = extract(snapshot)
Over the year, turbine generation is 80% of the electricity used for pumping. That matches the stated round-trip efficiency. The gap is storage loss.
julia> pump = balance(result, "Pumped hydro country1", :input, energy; collapse=true, aggregate=true)
104232.12827599999

julia> turbine = balance(result, "Pumped hydro country1", :output, energy; collapse=true, aggregate=true)
83385.7026208

julia> turbine / pump
0.7999999999999997
In the figure, daytime PV rises above demand. The first hatched band above the demand line is electricity used for pumping. Pumping is limited to 75 MW, so any further PV surplus is curtailed in the second hatched band. The reservoir level rises while that water is stored. Later the turbine releases it, limited to 50 MW, and the level falls. CCGT fills hours that storage still cannot cover: